2023年7月5日
A Map of the Observable Universe
Image Credit & Copyright: B. Ménard & N. Shtarkman; Data: SDSS, Planck, JHU, Sloan, NASA, ESA
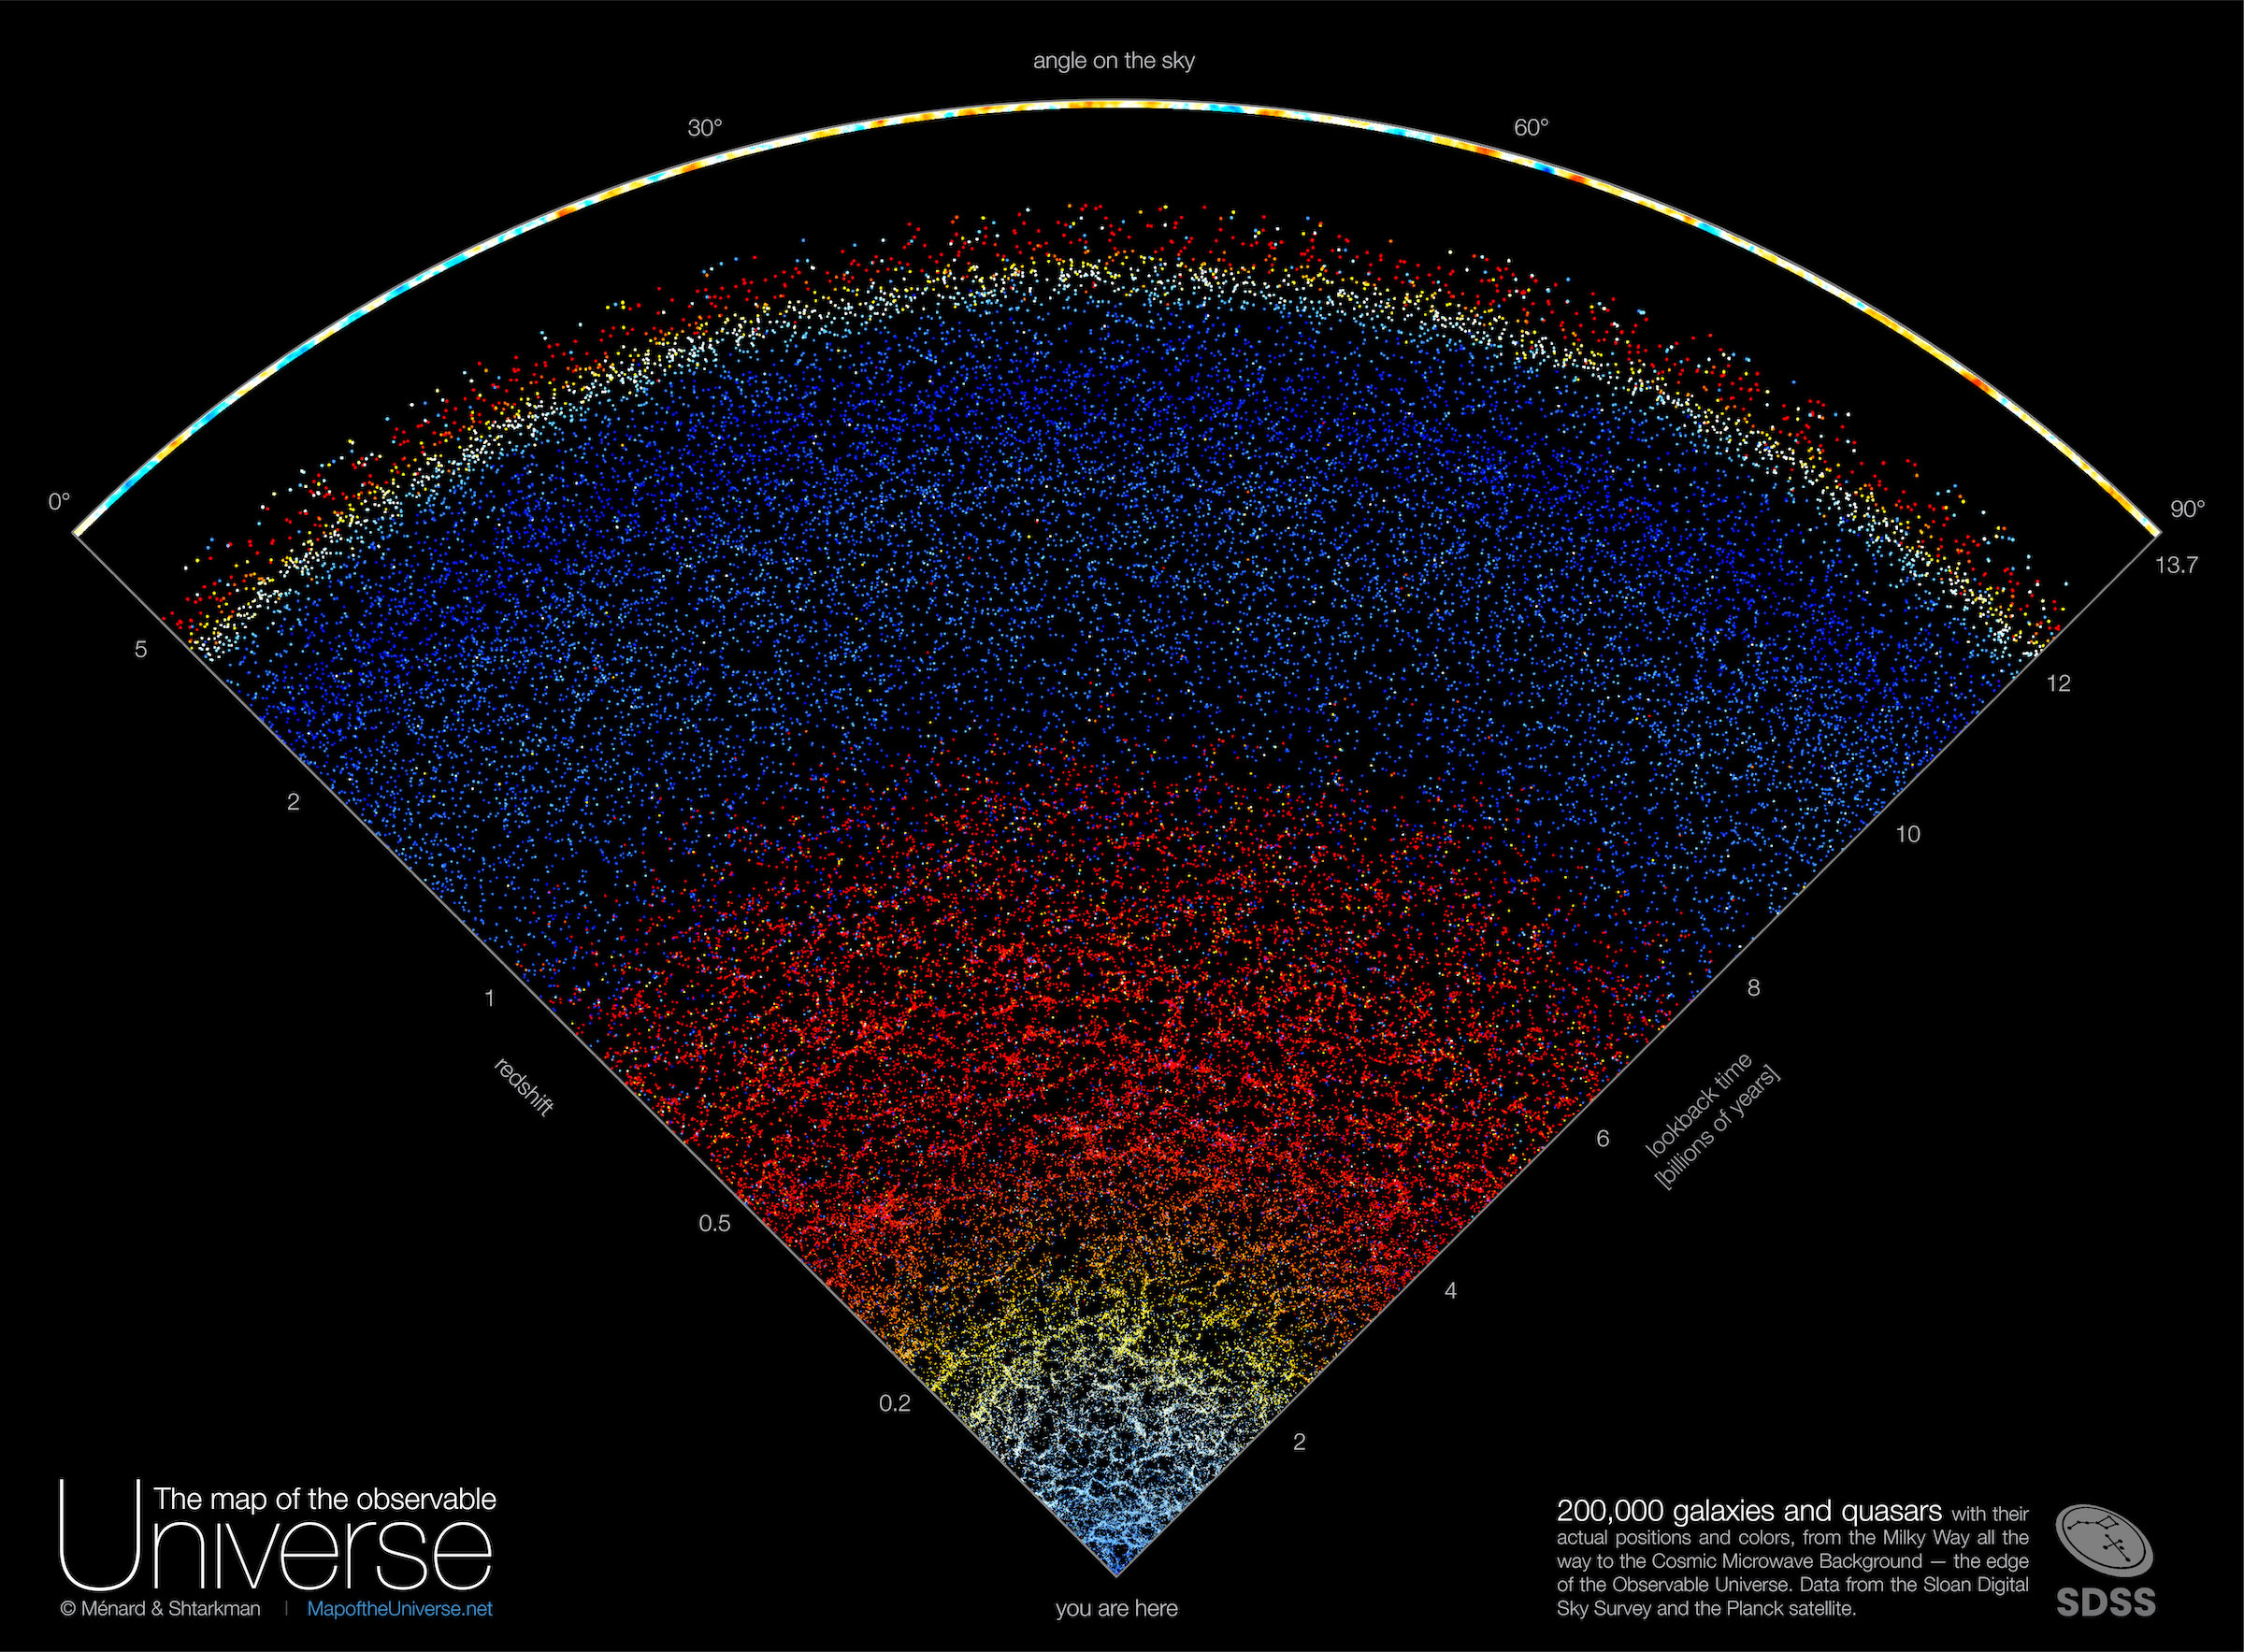
Explanation: What if you could see out to the edge of the observable universe? You would see galaxies, galaxies, galaxies, and then, well, quasars, which are the bright centers of distant galaxies. To expand understanding of the very largest scales that humanity can see, a map of the galaxies and quasars found by the Sloan Digital Sky Survey from 2000 to 2020 — out to near the edge of the observable universe — has been composed. Featured here, one wedge from this survey encompasses about 200,000 galaxies and quasars out beyond a look-back time of 12 billion years and cosmological redshift 5. Almost every dot in the nearby lower part of the illustration represents a galaxy, with redness indicating increasing redshift and distance. Similarly, almost every dot on the upper part represents a distant quasar, with blue-shaded dots being closer than red. Clearly shown among many discoveries, gravity between galaxies has caused the nearby universe to condense and become increasingly more filamentary than the distant universe.
More Detailed Maps: Related to Today’s APOD
Tomorrow’s picture: open space
可观测宇宙的分布图
图示提供与版权: B. Ménard & N. Shtarkman; 数据提供: SDSS, Planck, JHU, Sloan, NASA, ESA
说明: 假如你能看到可观测宇宙的边缘,会看见什么?你会看到星系、星系、星系,然后…或许加上类星体,因为它们是遥远星系的明亮核心。为了增进人类对可见宇宙最大尺度的了解,斯隆数字巡天计划把2000年到2020年之间所发现的、有些甚至位于可观测宇宙边缘的星系和类星体,绘制成分布图。上面这张主题图示呈现了其中的一个区块,大约由分布在回溯时间约120亿年及宇宙红移5之内的20万个星系和类星体所聚成之楔形区。在这个楔形图示的下半部,几乎每个点都代表一个星系,而愈暗的红色代表星系的红移愈大距离愈远。类似的,在楔形图示的上半部,几乎每个点都代表一个类星体,而其中的蓝点比红点近。在所获得的诸多发现之中,包括可清楚看到由于星系间的重力吸引之故,邻近宇宙空间凝聚出的丝状结构比遥远宇宙的要来得明显。
更详细的地图: 与今天的APOD相关
明日的图片: open space

